
Load test your API with vegeta
During the last few years, when I want to load test my APIs, my go to tool is vegeta. It is an awesome load testing command line tool. It is easy to use and its reporting capabilities and features are quite insightful and well-presented. In this post, we will create a tiny API in go and we will use vegeta to test its limits :)
So, let’s assume our API is comprised of a single endpoint that returns a list of users. Let’s build the API:
package main

import (
  "net/http"
  "encoding/json"
)

type User struct {
  Name string `json:"name"`
}

func main() {
  http.HandleFunc("/users", func (w http.ResponseWriter, r *http.Request) {
    users := []User{
      User{"John"},
      User{"Jane"},
    }

    w.Header().Set("Content-Type", "application/json")
    json.NewEncoder(w).Encode(users)
  })

  http.ListenAndServe(":8080", nil)
}
Ok, now it’s time to install vegeta. You can head over to releases page and download a precompiled executable, or install it from source with go get -u github.com/tsenart/vegeta.
Vegeta has a lot of options and flags you can set. You can examine all those by just executing vegeta from the terminal:
Usage: vegeta [global flags] <command> [command flags]

global flags:
  -cpus int
        Number of CPUs to use (default 8)
  -profile string
        Enable profiling of [cpu, heap]
  -version
        Print version and exit

attack command:
  -body string
        Requests body file
  -cert string
        TLS client PEM encoded certificate file
  -chunked
        Send body with chunked transfer encoding

...
...
Let’s see how we can perform some load tests and how to generate reports. The simplest call to vegeta would be:
bash echo "GET http://localhost:8080/users" | vegeta attackThe above call starts an attack to the endpoint (and http method) we pass to the vegeta attack stdin. By default, the attack has an infinite duration, so it does not stop until we terminate the command. A couple of the most important arguments we can use are duration and rate. By default, duration is set to 0 (infinite time attack), but we can set it to a duration of 10s for example for 10 seconds. The rate argument is set to 50 request per second (50/1s) by default. Let’s see an example:
bash echo "GET http://localhost:8080/users" | vegeta attack -duration=5s -rate=100The attack above would take 5 seconds to complete and it would perform 100 requests per second. As you can see, when you run this command, a bunch of binary data are sent to the standard output. This takes us to the next command: report. Vegeta uses these binary data to build its reports. So, in order to get a report for the attack launched above, we would need the results, in order to feed them to the report command:
bash echo "GET http://localhost:8080/users" | vegeta attack -duration=5s -rate=100 | tee results.bin
cat results.bin | vegeta report
What have we done above? We performed the same attack, but stored the results in a file. Then we pass the output of the file to the vegeta report command. Doing this, we get a report like that:
Requests      [total, rate, throughput]         500, 100.20, 100.19
Duration      [total, attack, wait]             4.991s, 4.99s, 638.056µs
Latencies     [min, mean, 50, 90, 95, 99, max]  262.44µs, 765.922µs, 764.903µs, 892.331µs, 930.816µs, 1.163ms, 2.508ms
Bytes In      [total, mean]                     17000, 34.00
Bytes Out     [total, mean]                     0, 0.00
Success       [ratio]                           100.00%
Status Codes  [code:count]                      200:500
As you can see above, the report is quite easy to read. The most important rows of the report are the Latencies, Success and Status codes. We see that all requests were successful with a status code of 200. In Latencies, we see the mean, minimum and maximum response time of a request and the most important percentiles (50, 90, 95 and 99%). So, from the report above, we see that 99% of requests have a response time of 1.163ms or less. Our API is great!
The default report type is text (the one we see above). Vegeta supports several reports like json, histograms etc. For example, if we change our report command to:
cat results.bin | vegeta report -type "hist[1000ns, 1ms]"we get this output:
Bucket         #    %       Histogram
[1µs,   1ms]   491  98.20%  #########################################################################
[1ms,   +Inf]  9    1.80%   #
Finally, if you are interested in a time series of the response times, you can easily create a plot with the plot command. The outcome of the plot command is an html file. Let’s see an example:
vegeta plot results.bin > plot.htmlNow, open plot.html with a browser and you will get a plot like that:
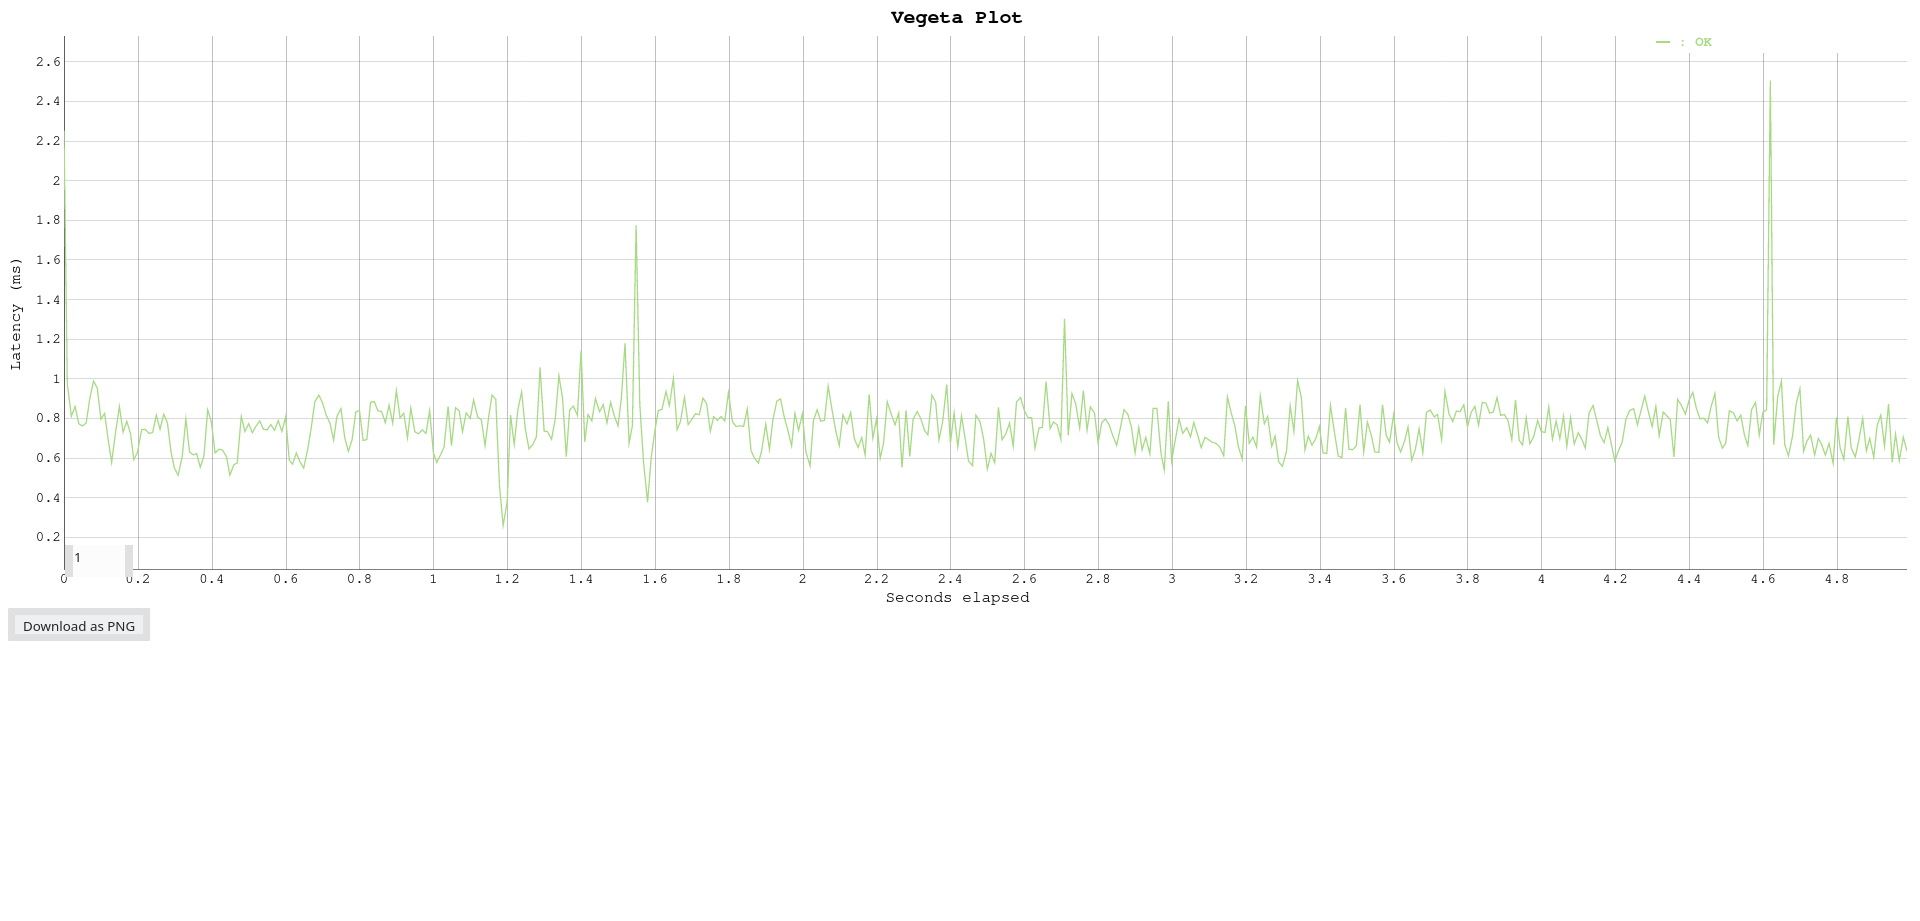
Note: the actual results and plot might be different on your computer.
Vegeta is awesome. I use it very frequently. It is easy to use and draw conclusions from its reports. Also, apart from using it as a cli tool, it can bee used as a library within your go code. Go ahead to vegeta github page to find out more.
That’s all for now!